



India's core industries grew at their fastest pace in the new data series in October 2026, with output up 10.9% from a year earlier. Coal, electricity, iron ore and cement powered the surge, but a weak base from last year flattered the headline. Here is what the data shows, and what it does and does not mean.
What the numbers say
The Index of Core Industries rose 10.9% year on year in October 2026, in provisional data released by the Ministry of Commerce and Industry on Friday, 20 November. That beat the revised 8.2% in September, the previous series high, and was far above the 0.8% recorded in October 2025. The index stood at 123.1 in October, against 111.0 a year earlier. Cumulative growth for April to October was 6.0%, against 2.3% in the same period last year.
What is the Index of Core Industries
The index tracks output in nine infrastructure sectors: coal, crude oil, natural gas, refinery products, fertilisers, steel, cement, electricity and iron ore. It is compiled by the Office of the Economic Adviser and released every month. The series was rebased to 2022-23 in July 2026, and iron ore was added to the basket. As the new series only goes back to April 2024, October's 10.9% is a series high, not an all-time record. Electricity has the largest weight at 30.93%, followed by refinery products at 22.57% and steel at 17.58%.
Why growth jumped in October
Two forces pushed it up. The first was real demand. Government spending on highways, ports and railways kept construction strong, lifting cement and steel, while higher power demand drove coal mining and power generation. The second was the base effect. Output grew only 0.8% in October 2025, partly because of a shift in the festival calendar, so this October was measured against a very low base. Aditi Nayar, chief economist at ICRA, said the print "signals a strong start for the third quarter of FY2027" but was "largely optical", and the October-November average would give a better picture once festival effects even out.
Which sectors led the surge
Five of the nine sectors grew. Iron ore led at 26.4%, followed by coal at 23.1% and electricity at 21.6%. Cement grew 15.4%, a series high and its fourth straight double-digit month, while steel rose 7.3%, its fastest pace in seven months. Coal India, the largest coal miner, reported output up about 19% to 67.2 million tonnes in October, much of it feeding power plants.
Where growth stayed weak
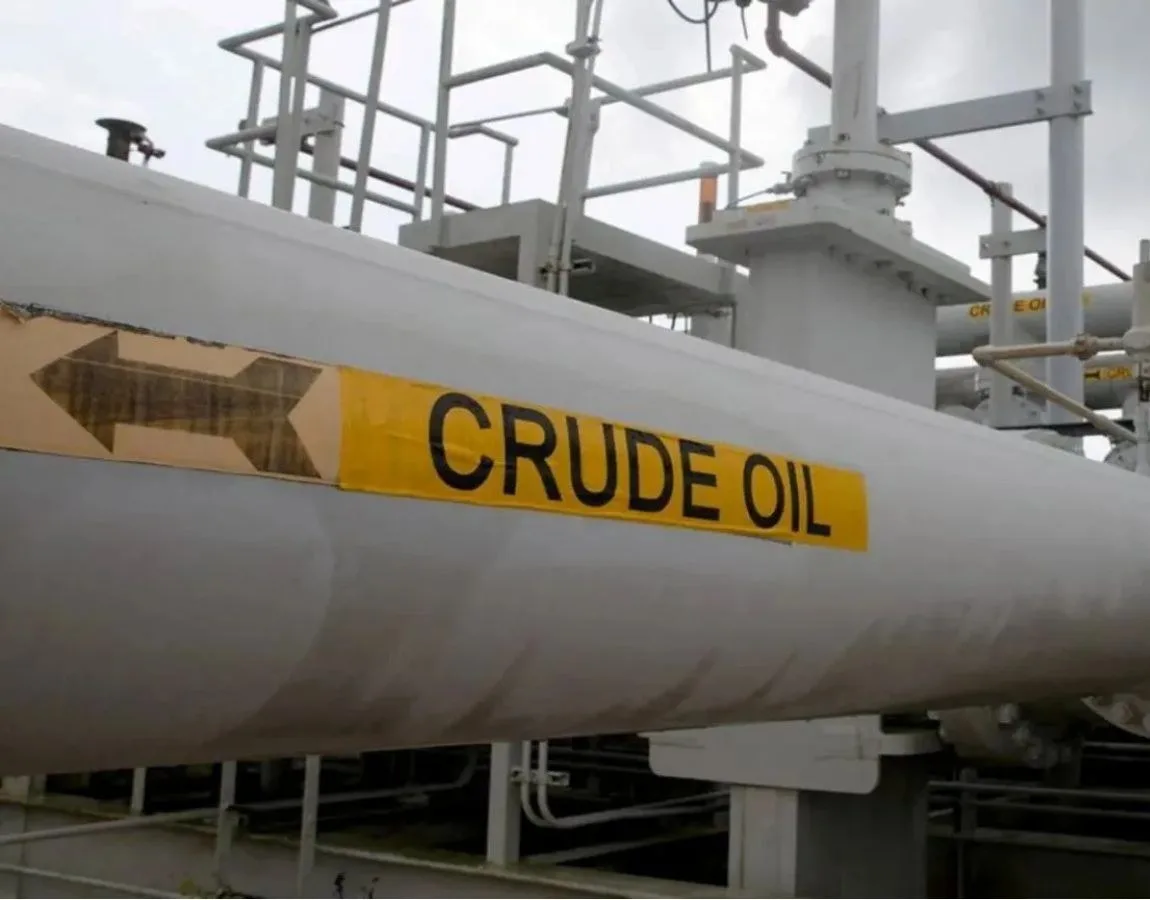
Three sectors contracted. Fertiliser output fell 12.2%, natural gas fell 7.6%, and crude oil fell 4.1%. Crude oil has now contracted for 22 consecutive months, and natural gas for 28 consecutive months. Refinery products, the second-heaviest sector, grew only 3.4%, slowing from 8.7% in September. The split shows the headline is not the whole story: infrastructure is strong, while fuel output keeps dragging.
What it means for the economy
The core data feeds into industrial production figures and is an early signal for GDP growth. A strong October points to a solid start for the third quarter of 2026-27. But economists caution against reading too much into one month when the base was so weak. The November data, due on 21 December, will show whether momentum holds once the festival effect washes out. For now, the picture is strong infrastructure demand, weak fuel output, and a headline that looks better than the underlying trend.
Frequently Asked Questions
What is the Index of Core Industries?
It is a monthly index tracking output in nine infrastructure sectors: coal, crude oil, natural gas, refinery products, fertilisers, steel, cement, electricity and iron ore. It feeds into the Index of Industrial Production.
Why did core sector growth reach 10.9% in October?
Strong growth in iron ore, coal, electricity, cement and steel drove it up, helped by infrastructure spending and power demand. It was also flattered by a low base, since output grew only 0.8% in October 2025.
Why are economists cautious about the 10.9% figure?
Much of the jump reflects the weak base and a shift in the festival calendar. ICRA's Aditi Nayar called the print "largely optical" and said the October-November average would give a better assessment.
Read More: Explained: Why India's Oil Import Bill Rose 54% in Seven Months
Read More: Explained: Why Gold Prices Have Fallen 25% in Nine Months
Read More: Explained: India's First Indigenous H5N1 Bird Flu Vaccine at Rs 1-2 a Dose
Read More: Explained: The CEC Law Row and the Supreme Court Recall Plea


Comments
Be the first to comment on this story.